
Fig. 5.
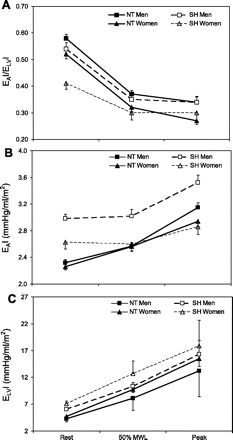
The change in EAI/ELVI (A), EAI (B), and ELVI (C) in NT (solid symbols) and SH (open symbols) men (solid lines) and women (dashed lines). At rest, EAI/ELVI is similar between NT and SH men and is lower in SH vs. NT women (P < 0.01). EaI/ELVI decreases during exercise in both NT and SH men and women (P < 0.01). There are no differences between NT and SH men and women at 50% maximal workload (MWL) or at peak exercise. At rest, EAI is higher in SH vs. NT men and women (P < 0.001). EAI increases during exercise in both NT and SH men and women (P < 0.05). However, only SH men have a higher EAI at 50% MWL and at peak exercise vs. NT men (P < 0.001), as no differences are found between NT and SH women at 50% MWL or peak exercise. At rest, ELVI is higher in SH vs. NT men (P < 0.05). ELVI increases during exercise in both NT and SH men and women. However, only SH men have a higher ELVI at 50% MWL or at peak exercise vs. NT men (P < 0.001), as no differences are found between NT and SH women at 50% MWL or at peak exercise. [Modified from Chantler et al. (15).]