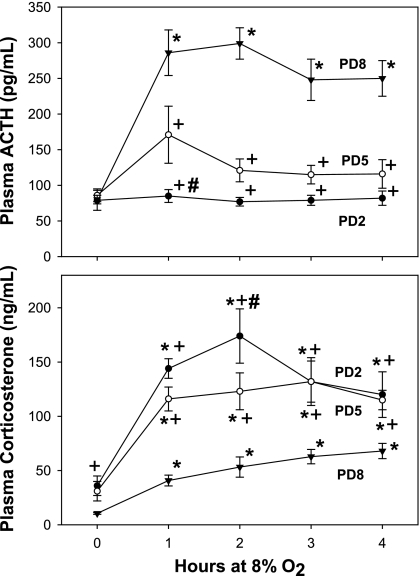
Fig. 2.
Plasma ACTH (top) and corticosterone (bottom) responses to acute hypoxia in neonatal rats at three different ages. Pups were placed in an environment chamber and exposed to a gas mixture consisting of 8% O2. At each time point, 2–6 pups were removed and immediately killed. Blood from 2 or 3 pups was pooled and treated as one sample; n = 5–7 measurements per age group (at each time point) for each analyte measured. *Significant difference from baseline within the same age group with P < 0.05. +Significant difference from PD8 within the same time point with P < 0.05. #Significant difference from PD5 within the same time point with P < 0.05.

