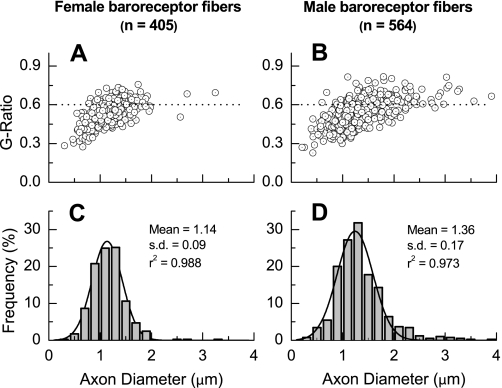
Fig. 7.
Scatter diagrams of G ratio as a function of axon diameter (A and B) and distribution frequency (C and D) of myelinated baroreceptor axon diameters from age-matched female (A and C) and male (C and D) Sprague-Dawley rats. Myelinated axon diameters binned in increments of 0.2 μm exhibited normal distributions (black lines represent an automated fit to the fiber diameter distributions with r2 values >0.95 for both graphs.) Axon diameter is the difference between fiber diameter (axon + myelin) and 2× average myelin thickness.

