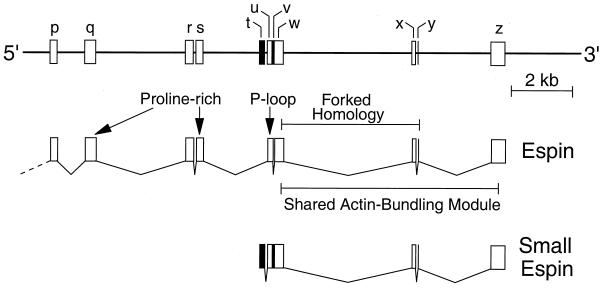
Figure 2.
Organization of the mouse espin gene. This diagram depicts the relative sizes and positions of the exons deployed differentially to construct small espin and approximately the C-terminal 60% of espin in the mouse. It highlights the positions of the exons that encode the two proline-rich peptides, the potential P-loop, the 66-amino-acid forked homology domain, and the shared C-terminal actin-bundling module (Bartles et al., 1996, 1998). The shaded exons, t and v, are specific to small espin. These sequence data are available from GenBank under accession number AF134858.

