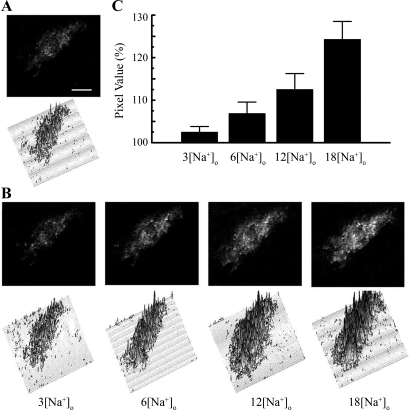
Fig. 4.
Increased TIRF level of GFP-tagged Na-K-ATPase-α1 in response to increased intracellular sodium concentration. A: control fluorescence image and corresponding pixel-by-pixel fluorescence determination of an OK cell obtained by evanescent wave illumination. Bar = 5 μm. B: TIRF images obtained at different sodium concentrations after the cell membrane was permeabilized with 10 μM gramicidin D. C: percentage of signal changes (means ± SD) observed in relation to control fluorescence levels from 18 different cells. Under basal conditions, these cells have an average of 9 mM intracellular sodium (10). Numbers on the abscissa indicate the increase of intracellular sodium with respect to the control basal intracellular sodium concentration level.

