Fig. 5.
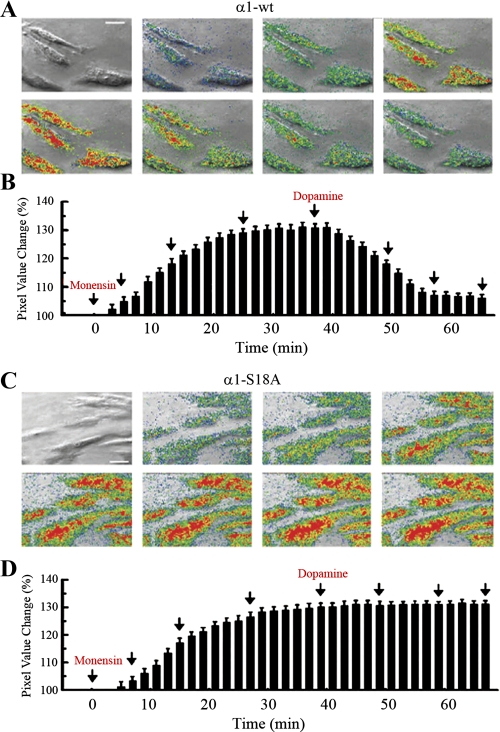
Fluorescence light changes under evanescent wave illumination evoked in OK cells by monensin and dopamine. TIRF determinations were performed in cells expressing either Na-K-ATPase-α1 (A and B) or the S18A mutant of this protein (C and D), both fused to GFP. Determinations illustrated in the histograms were performed every 2 min (B and D), and arrows indicate the times images illustrated in A and C were captured. Times of application of monensin and dopamine are indicated. Fluorescence increases were coded in pseudocolors and overlapped on a brightfield image of the corresponding OK cell acquired using Hoffman modulation contrast. Blue, green, yellow, and red represent signal increases equivalent to 1, 1.5, 2, 2.5, and 3 SD of the pixel variability in the image background, respectively. Bar = 5 μm.

