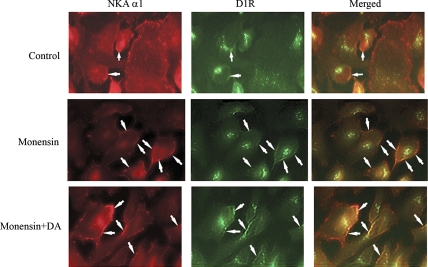
Fig. 6.
Colocalization of Na-K-ATPase-α1 and type 1 dopamine receptor (D1R). Images of OK cells expressing Na-K-ATPase wild-type α1 treated with vehicle (top), 5 μM monensin for 30 min (middle), and 5 μM monensin for 30 min, and then with 1 μM dopamine for 5 min (bottom) are shown. Fluorescence images were acquired through the Cy3 channel (Na-K-ATPase-α1) and the Alexa Fluor 488 channel (D1R). Merged images (right) were obtained using SimplePCI software. Cells were treated and images acquired as described in materials and methods. Arrows point to the sites of colocalization.

