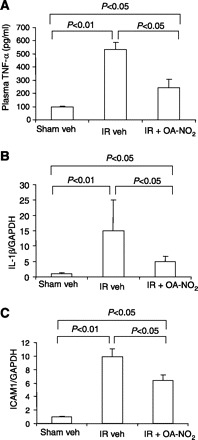
Fig. 4.

Levels of proinflammatory cytokines and adhesion molecules in sham veh, I/R veh, and I/R OA-NO2 mice. A: ELISA analysis of circulating TNF-α. B: real-time RT-PCR of renal IL-1β expression. C: real-time RT-PCR of renal ICAM1 expression. The expression was normalized by GAPDH. Values are means ± SE. Sham veh: n = 5; I/R veh: n = 6; I/R OA-NO2: n = 6.
