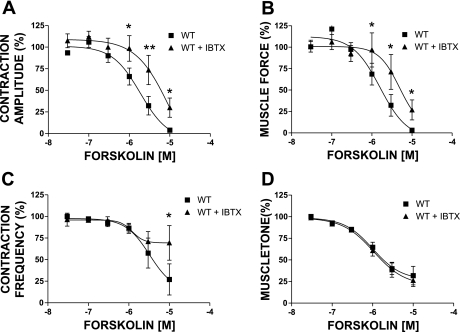
Fig. 5.
Concentration-response curves for the effects of forskolin (30 nM–10 μM) on the phasic contraction amplitude (A), muscle force integral (B), phasic contraction frequency (C), and muscle tone (D) in UBSM strips isolated from WT mice under control conditions and after the BK channel was blocked with IBTX (200 nM). In the presence of IBTX, the concentration-response curves were shifted to the right. Data are normalized to the 1 μM carbachol-induced contractions. Values are means ± SE (n = 5). *P < 0.05; **P < 0.01 (paired test).

