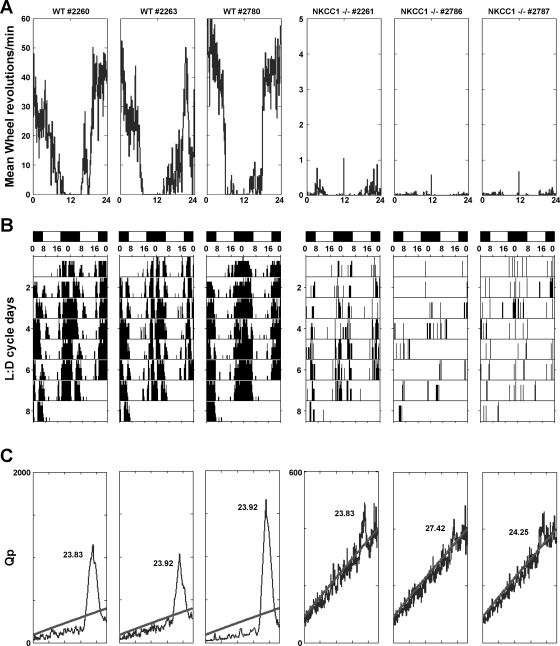
Fig. 4.
Wheel running activity in three individual WT (3 boxes on left) and three NKCC1−/− mice (3 boxes on right). A: mean wheel revolution counts over a period of 24 h (0–6 h = dark, 6–18 h = light, 18–24 h = dark); note change in axis in the NKCC1−/− plots on right. B: activity shown as actograms where wheel rotations are double plotted over 48 h; lighting conditions are indicated by black (dark, D)/white (light, L) bars; note clustering of activity during the nighttime. C: chi-square periodogram showing circadian rhythm strength (expressed as Qp value) on the ordinate vs. 24-h period on the abscissa. Values above the oblique line indicate times with significantly higher activity than background (P < 0.05). Peak height indicates rhythm strength, and time given is mean period length. Note change in axis in the NKCC1−/− plots on right.

