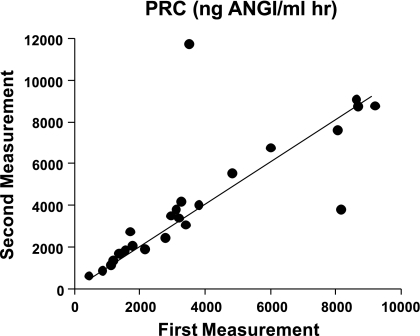
Fig. 5.
Repeat measurements of plasma renin concentration (PRC) in blood collected from the same animals at 48-h intervals. Line is the linear regression line relating values from first and second determinations. Experiments were done in 25 mice (9 WT and 16 NKCC1−/−) during both day (3 WT and 3 NKCC1−/−) and night (6 WT and 13 NKCC1−/−).

