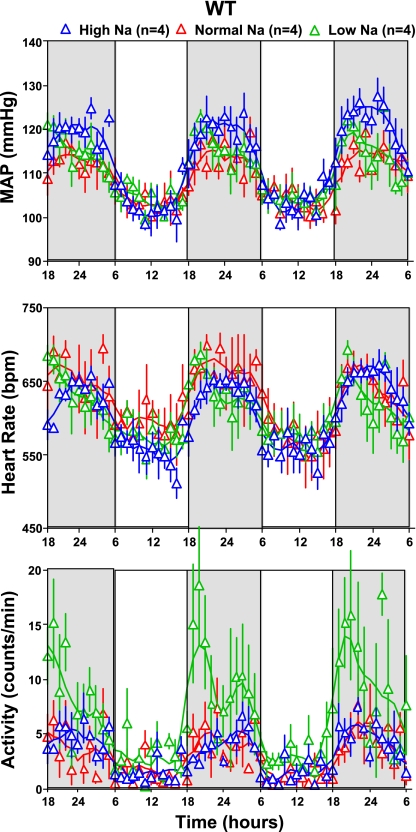
Fig. 8.
Hourly averages of MAP, heart rate, and locomotor activity measured over three successive days (night time indicated by darker shading) in 4 WT mice kept on normal (red), low-Na (green), and high-Na (blue) diets. Connecting lines represent smoothing using the weighted average of the 9 nearest points.

