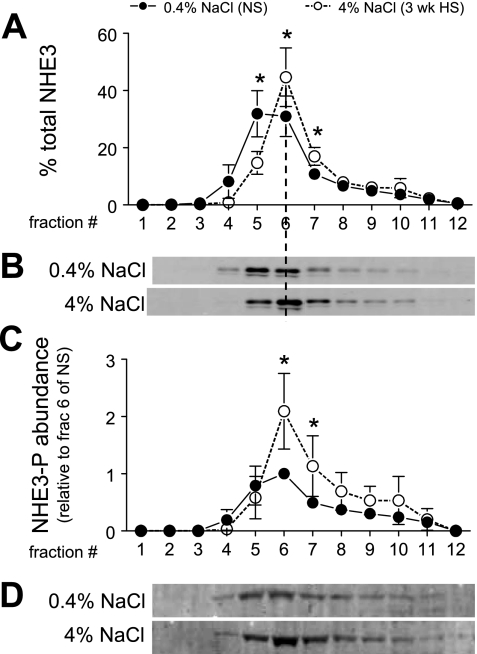
Fig. 3.
Density distribution of total NHE3 (A and B) and abundance of phosphorylated NHE3 (NHE3-P; C and D) in rats on 3-wk 0.4% NaCl (n = 5) or 4% NaCl (n = 5). In A, NHE3 immunoreactivity is expressed as % of the total signal in all 12 fractions. In C, arbitrary density values were normalized to the amount of protein loaded on the gradient and then normalized to fraction 6 of NS within each pair for statistical analyses. Typical immunoblots of total NHE3 (B) and NHE3-P at serine 552 (D) from a constant sample volume from each gradient fraction are shown. Values are means ± SD. *P < 0.05 vs. NS, assessed by ANOVA followed by paired Student's t-test.

