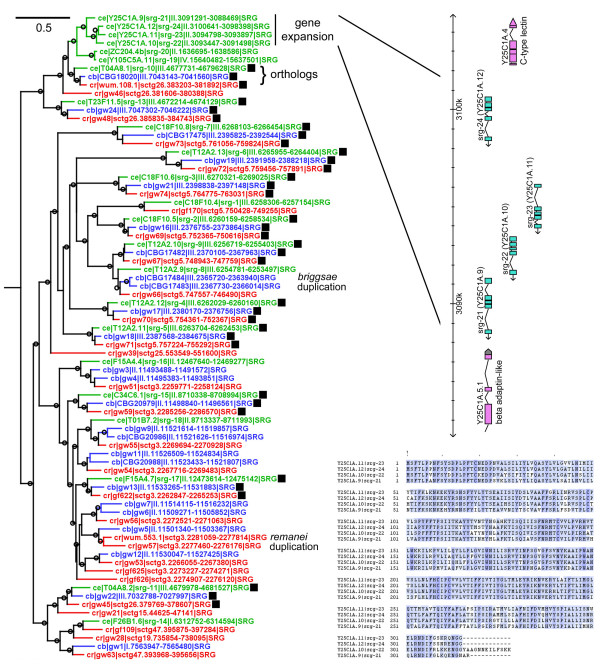
Figure 1.
Sample protein tree. This tree is a section from the complete SRG protein tree (Additional file 20). Protein names are colored by species (green is Caenorhabditis elegans, blue is C. briggsae, and red is C. remanei). In addition to identifiers, each name includes the genome position of the corresponding gene. Open circles on branches indicate a branch support value of 0.9 or higher, as computed by phyml-alrt. The scale bar indicates number of amino acid changes per site. Probable strict ortholog trios are marked with filled black squares. A representative gene expansion in C. elegans is marked and a view of the gene arrangement is expanded to the right (adapted from the WormBase genome browser, WS170). An alignment of four of the C. elegans proteins from this gene expansion is shown in the lower right. Blue coloring is proportional to amino acid conservation.

