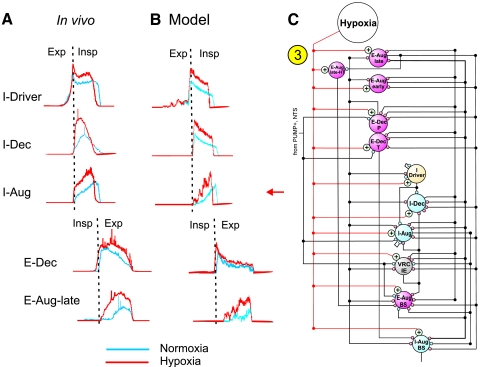
FIG. 8.
Modeling effects of hypoxia on the respiratory motor pattern during non-random eye movement (NREM) sleep. A: changes in the integrated profiles of activity of different respiratory neurons during hypoxia (red traces) vs. normoxia (blue) from a coordinated in vivo study by Lovering et al. (2006) and used with permission. B: activity profiles in different medullary model populations closely reproduced changes found during hypoxia in NREM sleep. Hypoxia was simulated by incorporation of additional source of excitatory drive. C: schematic shows excitatory inputs that simulated a “hypoxic drive” to the indicated VRC populations (perturbation 3). A fiber population consisting of 100 fibers, each with 100 excitatory synaptic terminals with a synaptic strength of 0.025 was used to represent chemoreceptor drive; each fiber had a firing probability of 0.05 at each simulation time step. This fiber population, in turn, excited a second-order “Hypoxia” effect neuron population; see Table A7 (appendix) for properties of this population and Table A8 (appendix) for details of connections with other populations represented in C. See text for further details.

