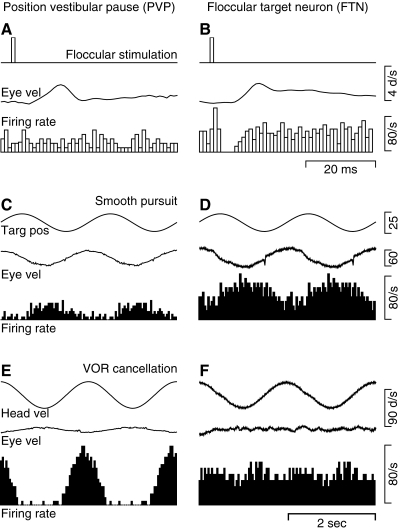
FIG. 2.
Response properties that define FTNs and PVPs. The left and right columns show responses of a PVP and an FTN. A and B: response to stimulation in the cerebellar floccular complex with single shocks. From top to bottom, the traces show the time of the stimulus, the average eye velocity evoked by the stimulation, and a histogram of the responses aligned on the time of electrical stimulation and averaged across 100 repetitions of the floccular stimulation. C and D: response during smooth-pursuit eye movements evoked by sinusoidal target motion at 0.5 Hz, ±10° with the head stationary. From top to bottom, the traces are target position, eye velocity, and a histogram of the neural responses accumulated by averaging across 20 cycles of pursuit. E and F: response during cancellation of the VOR induced by having the monkey track a target that moved exactly with him during sinusoidal head oscillation at 0.5 Hz, ±10°. From top to bottom, the traces are head velocity, eye velocity, and a histogram accumulated by averaging across 20 cycles of vestibular stimulation. A single cycle has been repeated in C–F to facilitate viewing of periodic events.

