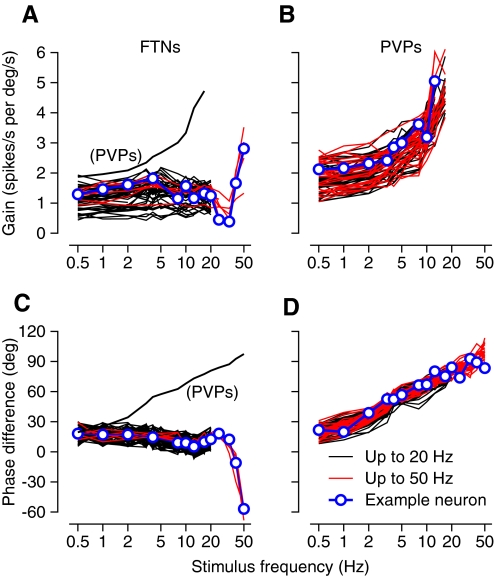
FIG. 4.
Gain and phase of responses of FTNs and PVPs during the VOR for stimulus frequencies over the range from 0.5 to 50 Hz. A and B: gain vs. stimulus frequency. C and D: the phase shift between firing rate and head velocity as a function of frequency, with positive values indicating that firing rate leads head velocity. Blue symbols and lines highlight data for single-example neurons. Red and black curves show data for neurons studied at frequencies from 0.5 to 50 Hz vs. those studied only for frequencies ≤20 Hz. The small number of FTNs studied at the highest frequencies is explained by the fact that one of our monkeys lacked a working floccular stimulating electrode for much of the time he was involved in brain stem recordings, whereas the other monkey had a stimulating electrode but was involved in experiments before we could retain isolation of FTNs during oscillation at 25–50 Hz. Thin black curves in A and C show the averages for the sample of PVPs; average gain is shown only for frequencies ≤12.5 Hz because many of the PVPs showed phase locking at higher frequencies.

