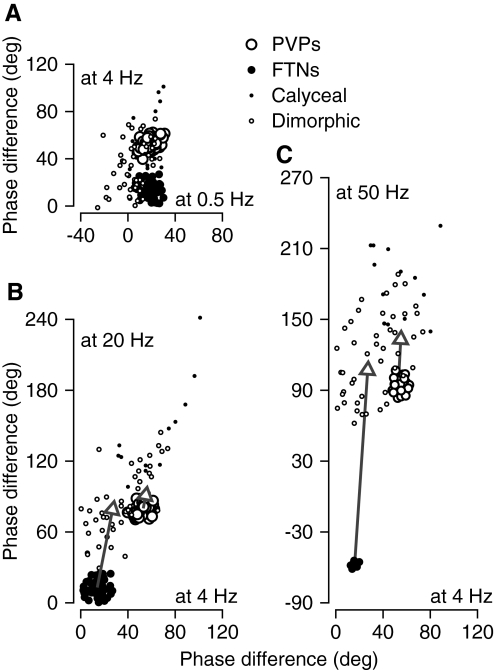
FIG. 8.
Comparison of phase shifts with respect to head velocity of FTNs, PVPs, and different groups of vestibular primary afferents. A: phase shift at 4 Hz vs. that at 0.5 Hz. B: phase shift at 20 Hz vs. that at 4 Hz. C: phase shift at 50 Hz vs. that at 4 Hz. Positive values of phase difference indicate that firing rate led head velocity. Large filled and open symbols plot data from this study for FTNs and PVPs. Small filled and open symbols plot data from putative calyceal and bouton/dimorphic afferents, taken from Fig. 5 of Ramachandran and Lisberger (2006). Arrows show how removing the phase shift attributable to the delays in the 2 pathways of the model alters the mean phase shifts of the 2 populations.

