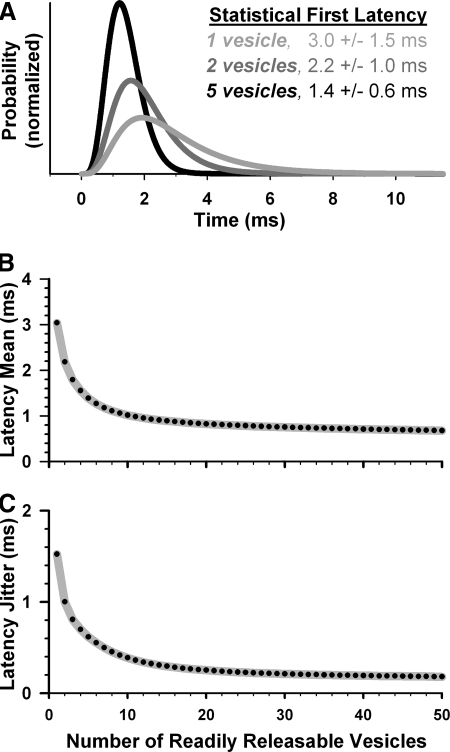
FIG. 1.
Statistical model predicts inverse relationship between readily releasable pool size and first-exocytosis latency. A: latency histogram for a single synaptic vesicle subjected to a step increase in calcium concentration to 50 μM (light gray line). Statistical estimate of first-exocytosis latency distributions if 2 (dark gray) or 5 (black) vesicles sampled the single-vesicle distribution. B and C: first-exocytosis latency mean and jitter values calculated across a range of readily releasable vesicles (black points).

