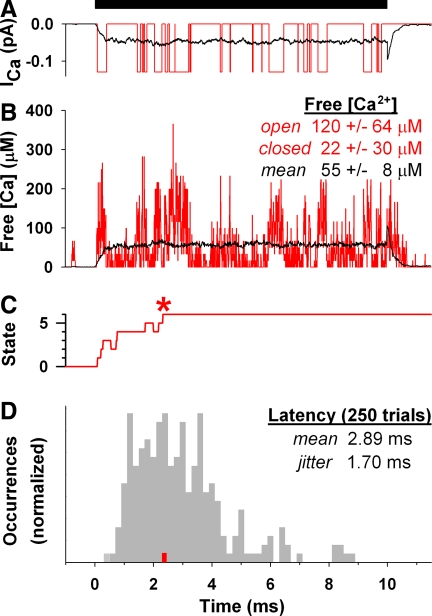
FIG. 4.
Individual vesicle exocytosis is not temporally precise. Top: stimulus bar indicates step to −20 mV from −80 mV. A–C: compare the results from a single trial (red lines) to the average of 250 trials (black lines in A and B; gray bars in D). A: influx through a single channel. B: calcium concentration within a (10 nm)3 volume element sampled by a colocalized vesicle, averaged every 10 μs. Mean ± SD calcium concentration of this single trial during channel open or closed times during the 10-ms stimulation, and the average concentration during stimulation of 250 trials. C: state transitions as vesicle bound 5 calcium ions (states 1–5) and exocytosed (state 6, *). Initially the vesicle has no bound ions (state 0). D: distribution of exocytosis times, binned at 0.2 ms.

