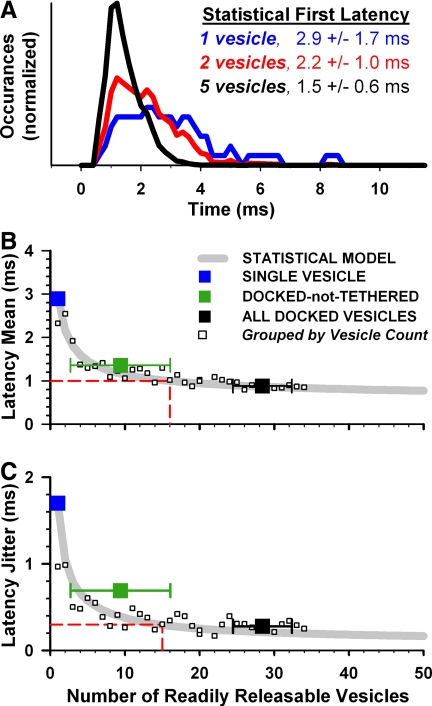
FIG. 6.
Exocytosis simulations validate the statistical model. A: latency histogram for a single colocalized vesicle (from Fig. 4D) smoothed with a 3-point triangle filter (blue line). Statistical estimate of first-exocytosis latency distributions if 2 (red) or 5 (black) vesicles sampled the single-vesicle distribution. B and C: first latency mean and jitter. Gray lines are statistical model predictions updated with biophysical model results. Large squares are stimulation results from Figs. 4 and 5, where the number of readily releasable vesicles equals the number of vesicles colocalized with channels. Small squares are simulation results divided into groups with the same number of readily releasable vesicles. Only groups with ≥5 trials were included (mean 13 trials/group). Horizontal dashed lines are minimum values observed in frog nerve fibers. Vertical dashed lines are the corresponding number of predicted vesicles.

