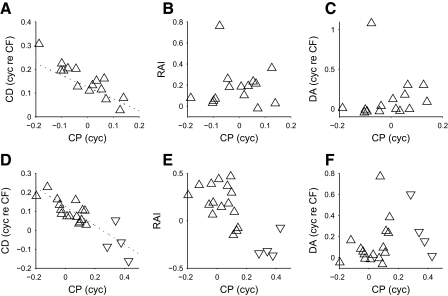
FIG. 11.
Testing the model of convergence. The CD and CP are negatively correlated in both DNLL (A) and IC (D), matching the relationship predicted in Fig. 10F. The dotted line indicates the relationship y = 1/8 − x/2, which corresponds to a linear shift from a stereotypical peak-type neuron (CD = 1/8 cyc re CF, CP = 0 cyc) to a stereotypical trough-type neuron (CD = −1/8 cyc re CF, CP = 0.5 cyc). In DNLL, the CP is not correlated with the rate asymmetry (B) or the delay asymmetry (C). However, in IC, the CP is negatively correlated with the rate asymmetry index (RAI, E) and the delay asymmetry appears to show a dependence on the squared sine of the CP (F). This is a close match to the relationships shown in Fig. 10, G and H. Both peak-type responses (upward triangles) and trough-type responses (downward triangles) are shown.

