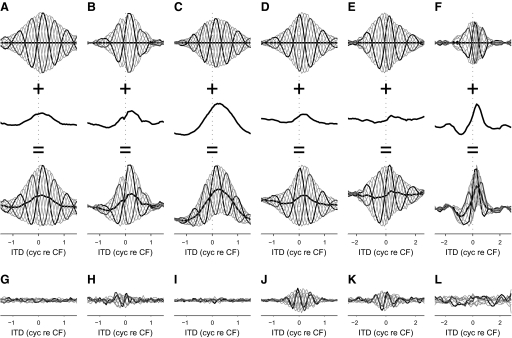
FIG. 5.
A–F: the creation of rate and delay asymmetry by an IPD-insensitive component. Bottom row: approximations of the noise-delay functions in Fig. 1, B–G, formed from the sum of the r1(τ, φ) components (top row) and the r0(τ) components (middle row). G–L: the residuals after subtracting the approximations in A–F from the original noise-delay functions (Fig. 1, B–G). Responses obtained at 0 cyc IPD (black) and 0.5 cyc IPD (dark gray) are highlighted; those at all other IPDs are shown in light gray. Equivalence contours are also shown (thick black lines). All components were smoothed (over ITD) by a 3-point moving-average filter for ease of viewing.

