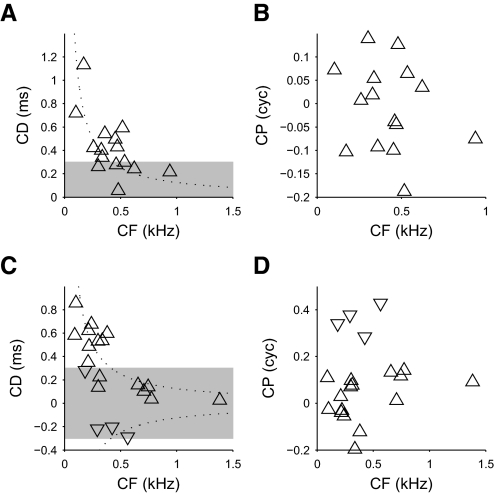
FIG. 7.
Time and phase contributions to the internal delay. A and C: the characteristic delay as a function of CF for both peak-type responses (upward triangles) and trough-type responses (downward triangles) in DNLL (A) and IC (C). The dotted lines show the characteristic delays (CDs) corresponding to ±1/8 cyc re CF and the shaded area shows the physiological range for the guinea pig (±300 μs). B and D: the characteristic phase (CP) as a function of CF for DNLL (B) and IC (D). CDs resemble the plots for best ITD (Fig. 6, A and C), whereas CPs are distributed around zero and have no systematic relationship with CF.

