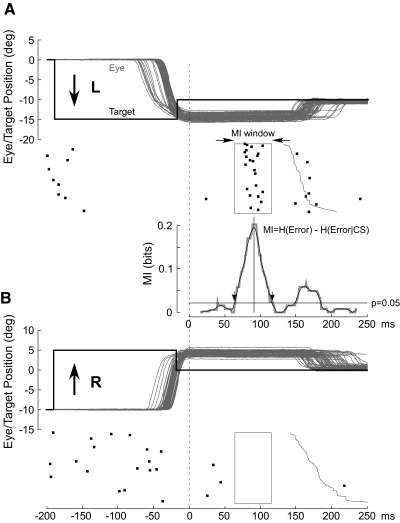
FIG. 1.
Examples of complex spike (CS) occurrences from a single P-cell to errors in opposite directions to show the mutual information (MI) analysis. A: 63 15° leftward target steps and 5° rightward intrasaccadic back steps produce 5° rightward errors, which are eliminated by rightward corrective saccades. B: 64 rightward target steps and leftward back steps cause a leftward error. In both A and B, all saccades are aligned on the end of the primary saccade and arranged from top to bottom in order of increasing latency of the corrective saccade (onset of the corrective saccade shown as jagged thin gray vertical curve). The initial target steps (black thick lines) were placed at the average saccade reaction time. Black dots represent the occurrence of CSs in relation to the associated eye and target movements immediately above. Beneath the CS rasters in A, we show the MI curve (gray) and its smoothed version (black) generated as described in detail in the text. Downward arrows, which mark the times when the smoothed MI curve crosses a probability threshold of 0.05 (black horizontal line), demarcate the width of the MI window (rectangles in CS rasters in A and B).

