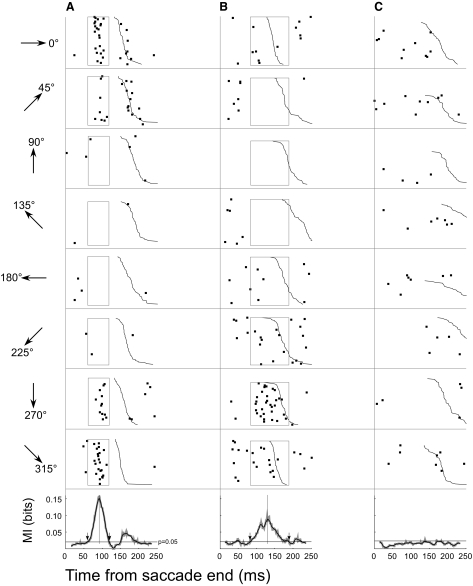
FIG. 3.
Examples of the directional selectivity of CS occurrence for 3 different P-cells (A–C). Each column shows a different neuron with CS rasters aligned on the end of the primary saccade at t = 0 and ordered from top to bottom according to increasing latency of the corrective saccade (jagged black curve). Those trials in which no corrective saccades occurred within the 250 ms were placed at the top, e.g., C, 180°. Each row shows the CS activity in 1 of the 8 directions indicated to the left by the arrows. In A and B, the rectangles mark MI windows where CS occurrence and error direction were significantly correlated (P < 0.05). Bottom panels show raw (gray) and smoothed (black) MI curves determined from data across all 8 directions. Downward arrows mark the threshold crossing times and identify the MI analysis window. Unit in A is the same as that shown in Fig. 1.

