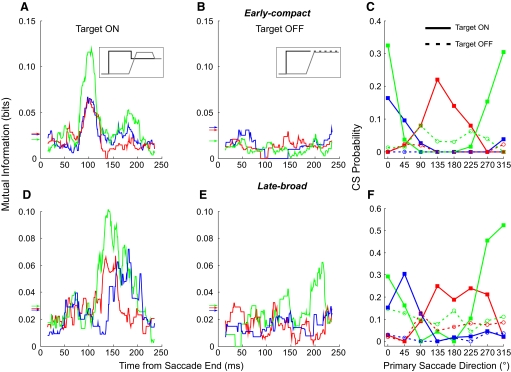
FIG. 6.
Demonstration that the information carried by a CS response depends on the presence of a visual error. A and D: MI curves in our normal target back-step paradigm (see inset in A) for 3 units with early-compact responses (A) and 3 with late-broad responses (D). B and E: MI curves of the same units to the left (matching colors) when the target is extinguished as the saccade is launched (inset in B). In this situation, CS mutual information is eliminated completely (B vs. A; 2 of 3 in E vs. D) or substantially altered (green response in E vs. D). Arrows indicate MI thresholds for significance (matching colors). C and F: CS probabilities within the MI windows during both target on (solid curves, filled squares) and off (dashed curves, open circles) plotted against the direction of the primary saccades for both early-compact (C) and late-broad (F) responses.

