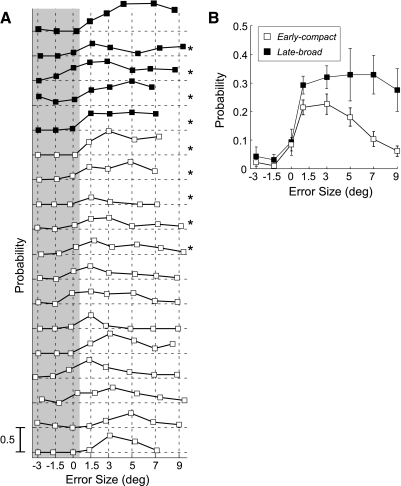
FIG. 9.
The relation between probability of CS occurrence and mean error size for all tested neurons. A: CS discharge probability as a function of error amplitude for each of 5 late-broad (filled squares) units and the 13 early-compact (open squares). Gray shading identifies data obtained for off-direction 3 and 1.5° errors and 0 error. *Neurons in which the relation between the CS occurrence and positive error sizes (unshaded data) was not significant (G statistics, P > 0.05). B: separate plots of the average probabilities with error size of the early-compact (open squares) and late-broad (filled squares) units. Error bars represent SE.

