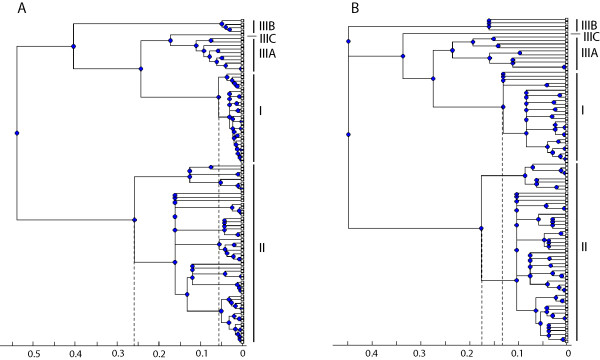
Figure 4.
Phylogenies inferred by ClonalFrame without (A) and with (B) correction for recombination. The phylogram (A) shows a 50% majority-rule consensus tree based on ClonalFrame output (see Methods section) for all 92 unique STs and ignoring the role of recombination. The phylogram (B) is the same, but recombination was taken into account in the model of genetic diversification. The rulers indicate the time in coalescent units. Dashed grey lines show the estimated time to the most recent common ancestors of lineage I and II.

