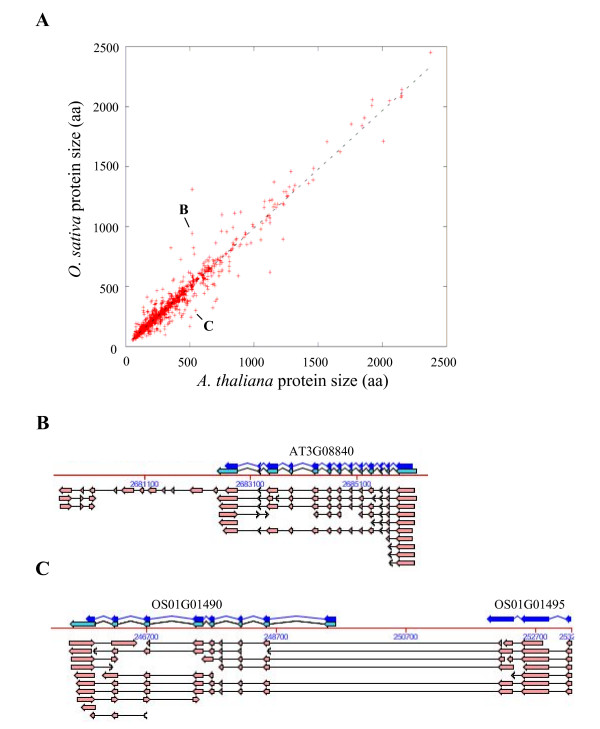
Figure 4.
Comparison of protein lengths in U{1:1} pairs. Each point represents protein lengths (in aa) of one U{1:1} pair of proteins (A). The linear correlation between U{1:1} protein sizes is represented by a dotted line (r2 = 0.94). Hand-checking of the largest differences showed that they are mainly due to erroneous predicted gene models with either an artificial exon gain/loss as in AT3G08840 (B) or a splitting/fusion process as in OS01G01490-OS01G01495 (C). Arrows and lines represent exons and introns while dark blue, light blue and pink colours represent predicted CDS, predicted mRNA and cognate transcripts (ESTs/cDNA), respectively. (B) and (C) are snapshots from FLAGdb++ [90].

