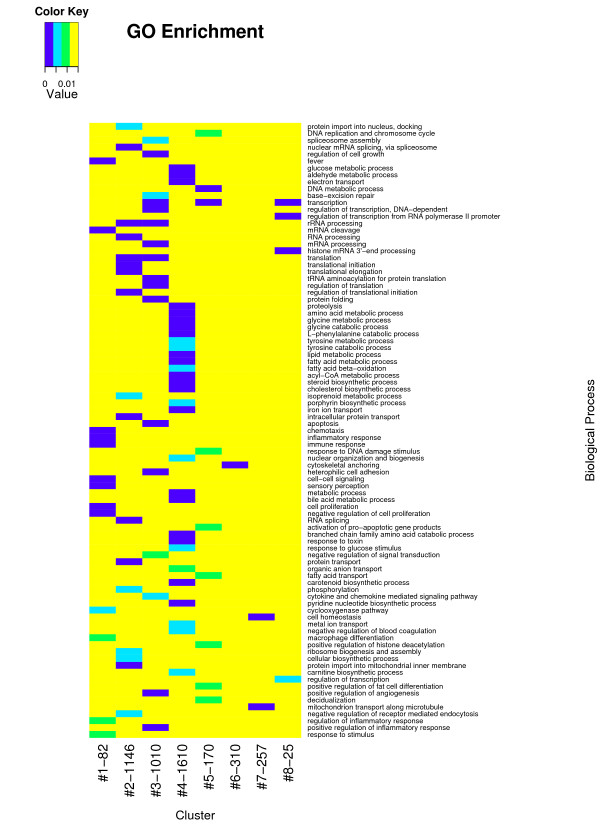
Figure 3.
Gene Ontology enrichment in individual cluster. In total 89 GO biological processes (rows) are overrepresented (p < 0.01) within the 8 clusters. Each cluster (columns) corresponds to a sub-tree mapped in Figure 1, with the expression profile and size illustrated in Figure 2. Referring to the scale of color key, each lane stands for the P value of overrepresented GO-BP within each cluster. The yellow background stands for the non-significance (p > 0.01).

