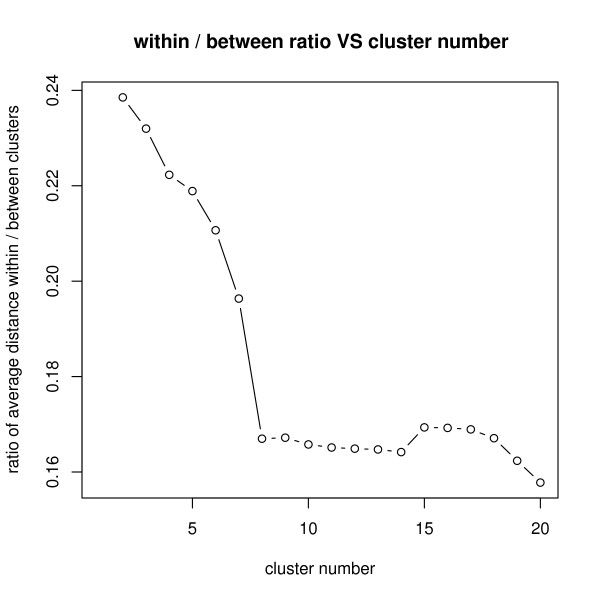
Figure 5.
Determine the number of clusters. 4610 differentially expressed transcripts were hierarchically clustered using Centered Pearson correlation. The optimum cluster number (X-axis) was determined using the ratio of the sums of squares between and within cluster (Y-axis). We chose 8 clusters as it classified the transcripts into relatively few clusters while maintaining maximum similarity of expression pattern within the same cluster.

