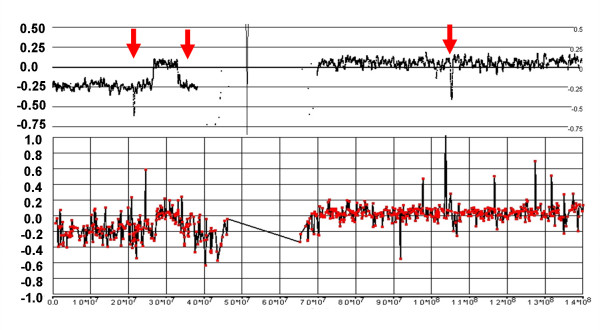
Figure 9.
Complex losses in the p-arm of Chr:9 of sample C79. The 500 K array generates a detailed fine mapping of this region compared with the grosser image from the 6 K BAC array. In particular, the BAC array misses losses at 10.32 – 11.83 Mb and 14.94 – 21.07 Mb, as well as a copy neutral region from 22.90–23.76 Mb (vertical arrows). Furthermore, the 500 K mapping clearly delineates a region of homozygous deletion from 21.07 – 22.90 that is not apparent on the BAC array (horizontal arrow).

