
Figure 2.
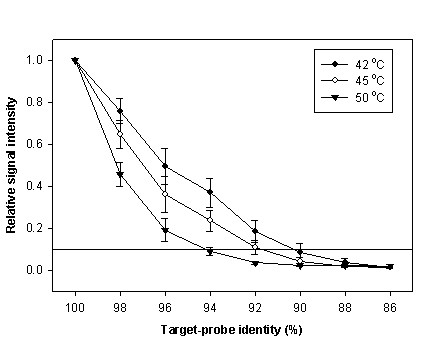
The relationship between probe-target identity and relative signal intensity at different hybridization temperatures. Each data point is the mean value from ten evenly-distributed MM probes. Error bars indicate standard error of replicate arrays.