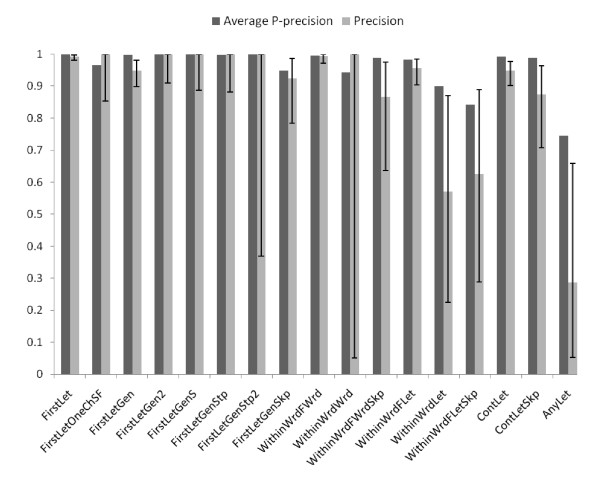
Figure 3.
Evaluation of strategies on 1250 MEDLINE records. Average P-precision is the mean of P-precisions of SF-LF pairs identified by that strategy (dark bars) and Precision is the number of gold standard pairs identified by a given strategy divided by the number of pairs identified by that strategy (light bars). An error bar denotes the 95% confidence interval of Precision. Long error bars correspond to small sample size for that strategy.

