
Fig. 7.
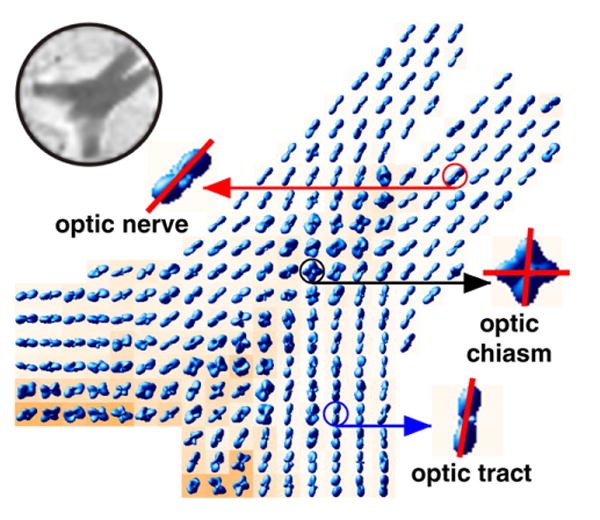
Probability maps computed from a rat optic chiasm data set overlaid on axially oriented GA maps. The decussations of myelinated axons from the two optic nerves at the center of the optic chiasm are readily apparent. Decussating fibers carry information from the temporal visual fields to the geniculate body. Upper left corner shows the corresponding reference (S0) image.