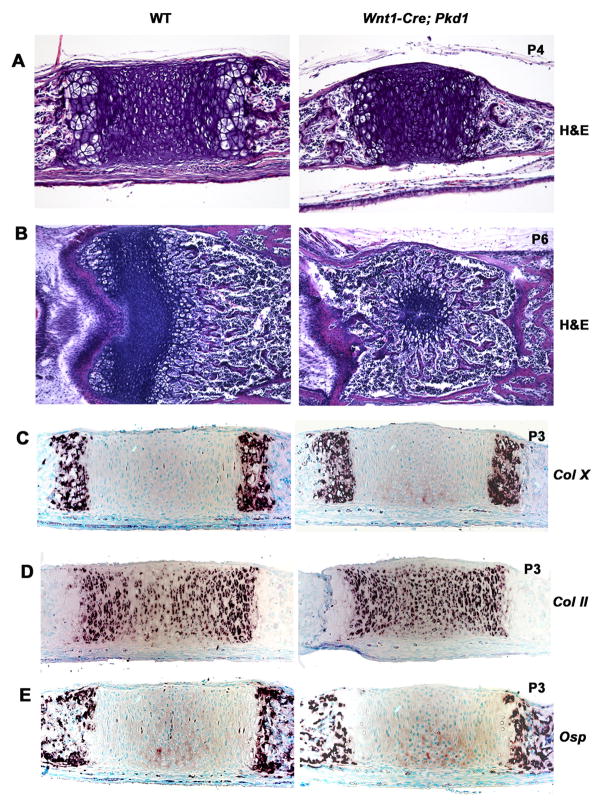
Fig. 3.
The distribution of the growth plate markers in the Wnt1-Cre;Pkd1 presphenoidal synchondrosis is normal prior to its closure. (A) H&E staining of the parasagittal sections of control and mutant cranial base at P4 demonstrates a reduction in length of the Pkd1-deficient PSS prior to its closure. (B) H&E staining of the transverse sections of the control and mutant PSS at P6 shows premature closure for the mutant synchondrosis. (C-E) Expression pattern of the type X (C), type II (D) and Osteopontin in the P3 control and mutant PSS visualized by in situ hybridisation show no strong differences.

