
Figure 1. Effects of Arp2/3 and CP on steady-state motility.
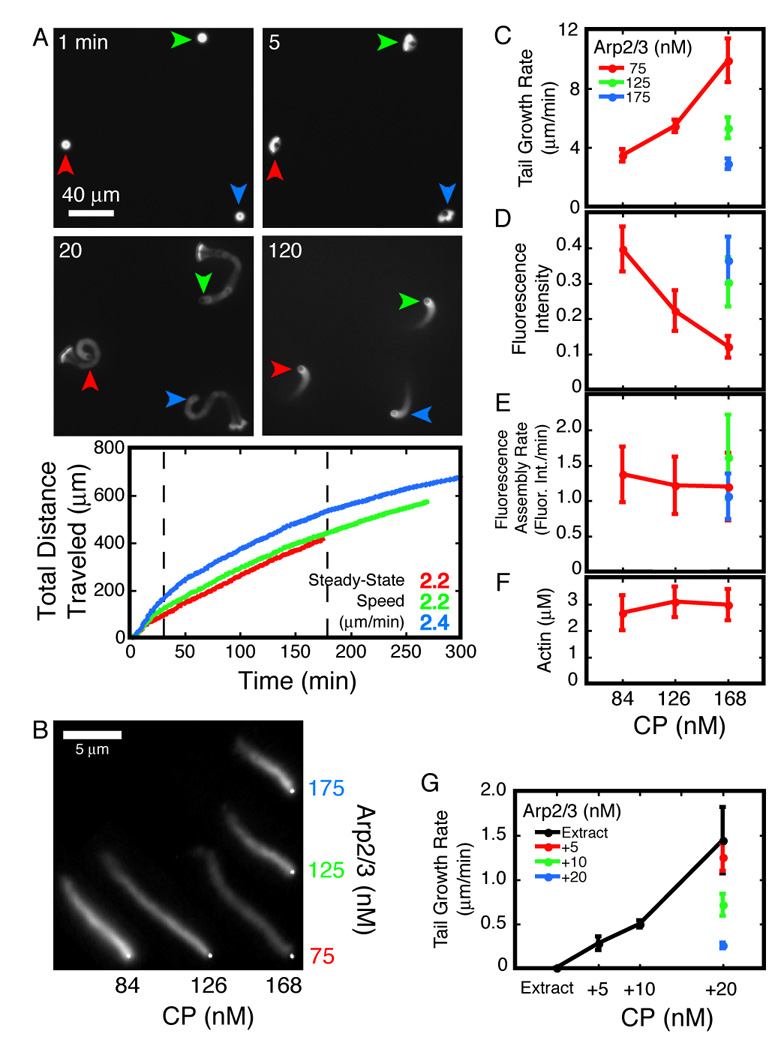
A. Panels: Four stages of motility—shell building, symmetry breaking, transient burst, and steady-state (clockwise, starting from top-left.) Arrowheads track individual beads through the panels. Graph: Total distance traveled by beads in the panels. Curves and speed figures are color-matched to the arrowheads. Steady-state speeds are the slopes of data between the dashed lines (30 to 180 minutes). Conditions: 5 µm ActA-coated beads mixed with 7.5 µM actin (5% TMR-labeled), 5 µM cofilin, 3 µM profilin, 120 nM Arp2/3, 168 nM CP.
B–F. Representative actin comet tails assembled on 220 nm ActA-coated beads in the presence of various concentrations of Arp2/3 and CP as indicated. Images were acquired approximately 30 minutes after mixing. Brightfield bead images and fluorescent comet tails were digitally merged for presentation. Brightness and contrast of the fluorescent images were set to the same values. Conditions: 7.5 µM actin (5% TMR-labeled), 4 µM cofilin, and 3 µM profilin.
C. Rate of motility decreases with [Arp2/3] and increases with [CP]. Each data point is the slope of the line fit to a time series of length measurements. Error bars are slopes of fits to the standard deviation of each time series (average n=140).
D. Actin density in the comet tails increases with [Arp2/3] and decreases with [CP]. Fluorescence intensities along single-pixel spines of actin comet tails were measured. Each data point is the intensity averaged over the first micron length of the tails. Error bars are standard deviations for 20 comet tails.
E. Rate of actin network assembly does not change with [Arp2/3] or [CP]. Rate of fluorescent actin incorporation is the product of tail growth rate (C) and fluorescence intensity (D). Error bars mark the product of the upper and lower error limits of the two terms.
F. Soluble actin concentration at steady-state does not change with [Arp2/3] or [CP]. Error bars mark the standard error for 3 independent measurements.
G. Rate of motility in brain cytosolic extract decreases with [Arp2/3] and increases with [CP]. Rates of tail growth on 220 nm ActA-coated beads were measured as in (C); see text for details. Each data point is the slope of the line fit to a time series of length measurements. Error bars are slopes of fits to the standard deviation of each time series (average n=77). Conditions: Brain cytosolic extract supplemented with 2 µM actin (10% TMR-labeled) and Arp2/3 and CP as indicated.