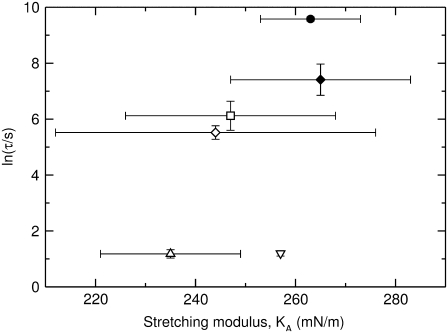
FIGURE 3.
The average time constant (τ) for CF release induced by δ-lysin as a function of the stretching modulus, KA, for POPC (∇), SOPC (Δ), di18:3PC (◊), di18:2PC (□), di18:1PC (♦), and di22:1PC (•). Each vertical error bar represents the standard deviation of a minimum of five individual kinetic traces. The peptide concentration in the dye release experiments was 0.5 μM and the lipid concentration was 50 μM. The values for KA and their standard deviations were taken from Rawicz et al. (39).

