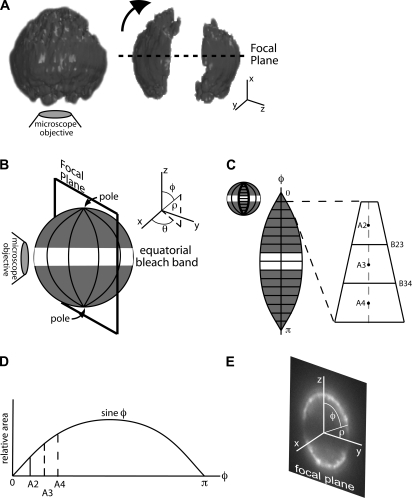
FIGURE 1.
Photobleaching a spherical resting neutrophil. (A) Three-dimensional reconstruction of a neutrophil fluorescently labeled for L-selectin before and after photobleaching shows a nearly uniform rectangular bleach cross section in each focal plane. For purposes of analysis, the optical axis is designated as y and the focal plane as x-z. (B) Rotated orientation illustrates the coordinate system for analysis with symmetry about the z axis. φ is the only direction in which fluorescence gradients exist. (C) MC simulations model diffusion of fluorescent “molecules” along φ that step forward or backward during each time step. (D) Width and area of simulation elements in φ is a function of the sine of φ, making it more likely that a molecule will diffuse toward the equator than toward the pole (see text). (E) Postphotobleach image with the coordinate system overlaid in the same orientation as B.

