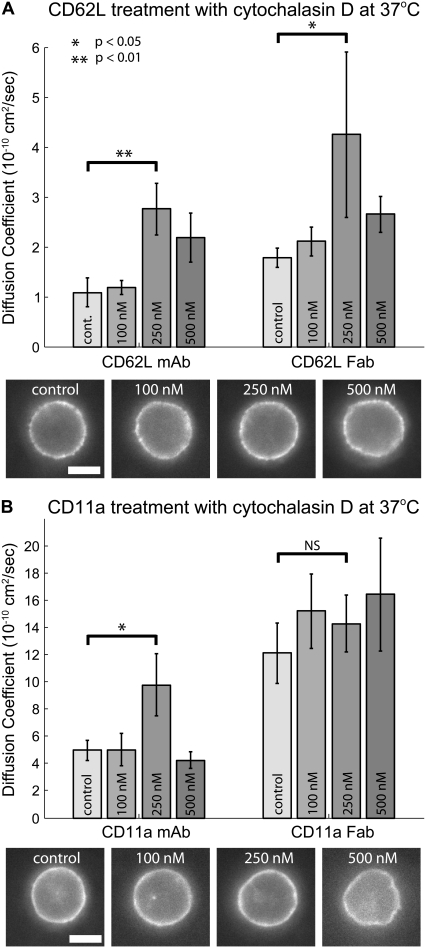
FIGURE 6.
Dose-dependent response of cytochalasin D on lateral mobility at 37°C. (A) Effects of cytochalasin D on CD62L mobility. Cells labeled for CD62L with mAb display maximal mobility at 250 nM cytochalasin D. Lateral diffusion coefficients for CD62L labeled with Fab showed a similar trend with the maximum lateral mobility at 250 nM cytochalasin D. Characteristic images of cells labeled for CD62L with Fab show that increasing concentrations of cytochalasin D causes morphological changes. At concentrations >500 nM, cells became highly irregular in shape and label-internalized. (B) Effects of cytochalasin D on CD11a mobility. Cells labeled for CD11a with mAb showed minimal change in lateral mobility at 100 nM cytochalasin D, but a significant increase in lateral mobility with 250 nM cytochalasin D (p < 0.05). Mobility decreased at higher concentrations of cytochalasin D. Lateral diffusion coefficients for CD11a labeled with Fab were the highest measured and did not increase further with cytochalasin D. Characteristic images of cells labeled for CD11a with Fab show that increasing concentrations of cytochalasin D causes morphological changes. In all experiments, cells were pretreated with varying concentrations of cytochalasin D for 15 min and then imaged at 37°C. Scale bar is 5 μm.

