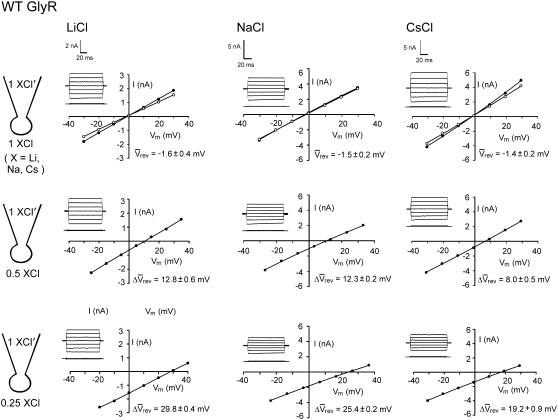
FIGURE 1.
Sample whole cell measurements of I/V curves for recombinant WT α1 GlyR channels in different dilutions of LiCl, NaCl, and CsCl solutions. Each column of I/Vs was recorded from the same cell, as the extracellular salt solution was diluted from its control concentration of ∼145 mM XCl, (1 XCl), where X represents Li, Na, and Cs, to ∼75 mM XCl (0.5 XCl), to 37.5 mM XCl (0.25 XCl), and then returned to the control concentration (1 XCl; points now shown as open circles; N.B., for the NaCl solution data shown; the before and after controls were almost identical). The pipette 1 XCl′ solution was almost the same as the 1 XCl solution except that it contained a small amount of CaCl2 and EGTA to chelate the Ca2+ (full details of the solutions are given in Materials and Methods). Sets of current traces for voltage steps from 0 mV to −30 mV (bottom trace) and in increments of 10 mVs to +30 mV (top trace), in the presence (top) and absence (bottom) of glycine are shown in the inset of each graph. The potentials were all corrected for liquid junction potentials and the average reversal potentials (Vrev) and their shifts (ΔVrev) for all the cells are shown with each graph (with bars over the top of the symbols to denote averaged values). The ΔVrev values for all the diluted solutions are positive, indicating that the channel is anion-selective. However, the values are greater for the LiCl solutions, indicating that the relative counterion permeability for Li+ is less than it is for Na+. In contrast, the ΔVrevs are smaller for the CsCl solutions, indicating that the relative counterion permeability for Cs+ is greater than it is for Na+.

