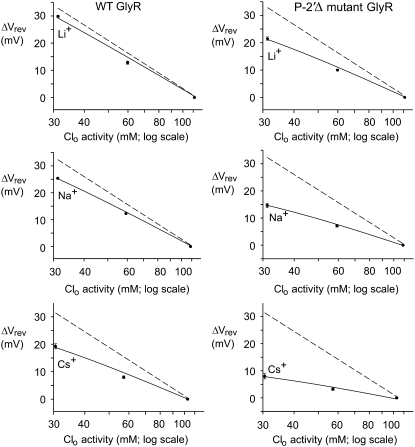
FIGURE 3.
Semilogarithmic plots of the average shifts in reversal potential, ΔVrev, versus external Cl− activity (on a log scale) for the anion-selective WT and P−2′Δ GlyR channels in 1, 0.5 and 0.25 LiCl, NaCl, and CsCl solutions. The solid lines show fits of the GHK equation (Eq. 2) to the ΔVrev values, as used to determine PCl/PNa averaged from individual experiments and shown in Figs. 1 and 2. The dashed lines indicate the ΔVrev values expected if the counterion permeability had been zero. The errors shown, when larger than symbols, are the SEs.

