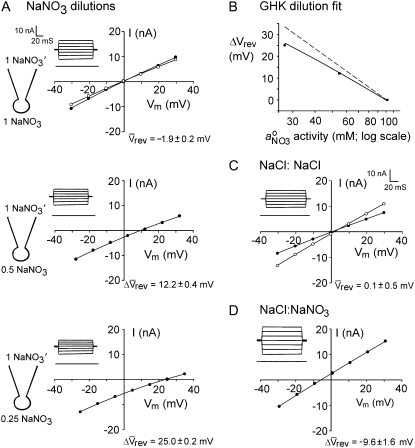
FIGURE 4.
Dilution potentials in NaNO3 solutions and biionic NaCl:NaNO3 solutions to determine relative PNO3/PNa and PNO3/PCl values, respectively, for the WT α1 GlyR channel. (A) Sample whole cell measurements of I/V curves in different dilutions of NaNO3 solutions to determine PNO3/PNa. The experimental procedures are identical to those described for Fig. 1 and the solution composition is given in Materials and Methods. As in Figs. 1 and 2, the ΔVrev values for the 0.5 and 0.25 dilution solutions are both positive, indicating that the WT GlyR channel is still anion-selective when  replaces Cl−. (B) Semilogarithmic plots of the averaged shifts in reversal potential versus external
  activity (on a log scale). The solid lines show the fits of the GHK equation (Eq. 3) to these ΔVrev values, as used to determine PNO3/PNa, averaged from individual experiments and shown in panel A. Again, as in Fig. 3, the dashed line indicates the ΔVrev values expected if the counterion permeability had been zero. (C and D) Sample I/V curves in symmetrical NaCl solutions (C), before (solid circles) and after (open circles) measurements of biionic potentials in NaCl:NaNO3 solutions (D). Both panels A and B are for the same cell, and panels C and D are for the same cell (though for a different one from that in panels A and B). The insets with the I/V curves show representative current traces in response to voltage steps (from 0 mV to −30 mV) (lower traces) through to +30 mV (top traces) in increments of 10 mV. The lower sets of current traces in each panel show control responses in the absence of glycine.

