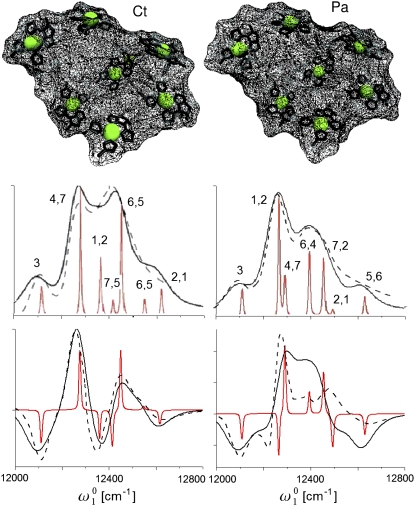
FIGURE 1.
Left column (top), structure of the FMO complex from the C.t. green sulfur bacteria. Surface wireframes around BChl molecules reveal the differences in the protein environment. Linear absorption (middle) and CD spectra (bottom): experimental (dashed line) and simulated (solid line) spectra. An overdamped Brownian oscillator model at 77 K (Λ−1 = 100 fs, λ = 55 cm−1) was used for the line broadening. Stick spectra are shown in red. The BChls with the largest contribution to each peak are indicated (in decreasing order of the contribution). The right column shows the same data for the P.a. green sulfur bacteria.

