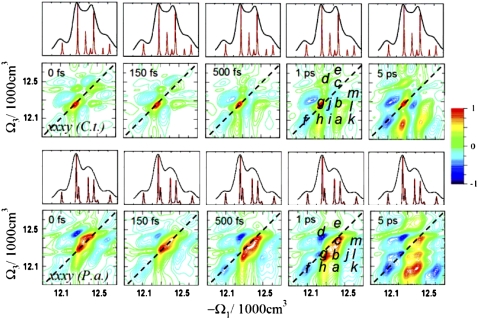
FIGURE 5.
Simulated 2D ECI xxxy (T8) spectra of FMO from C.t. and P.a. for several time delays t2. Compared with the xxxx spectra in Fig. 2, these spectra reveal new well-resolved crosspeaks i–m. The electronic structure differences between C.t. and P.a. are thus amplified.

