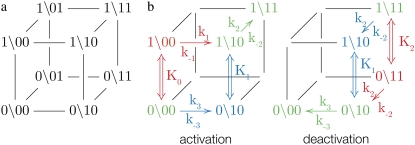
FIGURE 2.
The TnC-TnI assembly represented as a Markov network (see text). (a) The parent network with system-states (s0\s1s2) as nodes and bi-directional transitions as edges. (b) Reduced models of activation and deactivation showing transition rates ki, i = 1, 2, 3, Ca2+ affinity constants Kj, j = 0, 1, 2, kinetic linkages between activation and deactivation, and degeneracy in k2 and k−2. Dominant (red) are minor (blue) pathways and common portions (green) are shown. Double arrows indicate transitions with the reversible binding of Ca2+. For protein isomerizations, single arrows indicate the direction of net probability flux.

