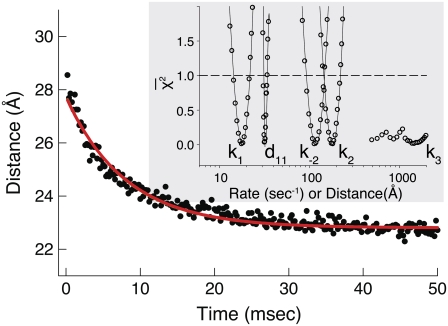
FIGURE 6.
Deactivation kinetics after Ca2+ removal, 15°C. FRET optical distance change after rapid mixing of Ca2+-saturated TnC-TnI with buffer containing Ca2+ chelator, EGTA. Empirical single-exponential fit (green, obscured by red trace): τ−1 = 125 s−1. Global model-based fit (red) with derived parameters in Table 1. (Inset)  (Eq. 22), the normalized adiabatic projection of the global χ2 hypersurface on a model parameter (labeled) axis.

