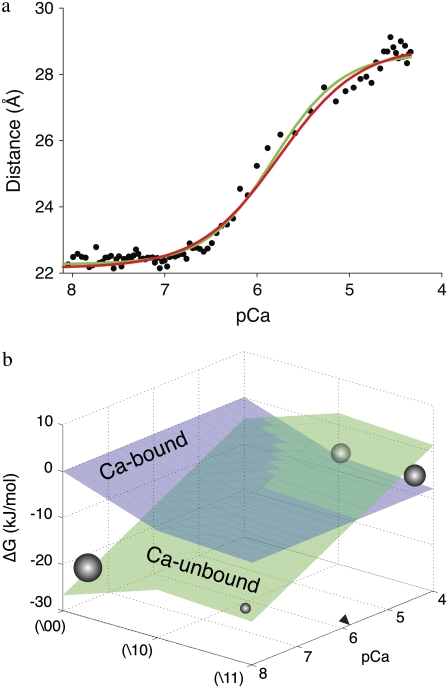
FIGURE 7.
System response to a change in [Ca2+]. (a) Ca2+ titration, mean FRET distance versus pCa (−log([Ca2+])). Empirical fit to the Hill equation (green) (n = 1.18; pCa50 = 5.82). Global fit to the model (Eqs. 2, 5, and 6) (red) (βΔμ′ = 22.9 kJ/mol). (b) The experiment-resolved macroscopic free energy landscape (see text, T = 15 C). Ca2+-unbound system-states (green). Ca2+-bound system-states (blue). Population density (spheres, radius represents magnitude) at the extremes of activation. pCa50 (labeled as a right arrowhead).

