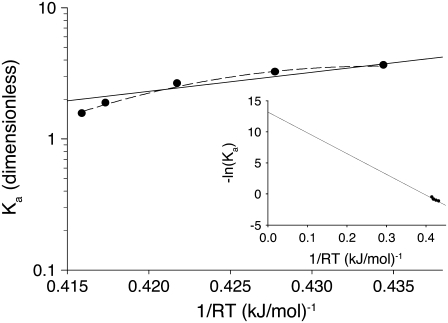
FIGURE 9.
Thermodynamic analysis of the induced fit opening step of activation. The temperature-dependent equilibrium constant, Ka = k2/k−2, (circles) from k2(T) and k−2(T) (Fig. 8) were fit using Eq 28 with temperature-independent ΔH and ΔS (solid line) and temperature-dependent ΔH and ΔS (dashed line). Recovered ΔH, ΔS, and ΔCp are given in Table 2. (Inset) van 't Hoff plot showing extrapolated results from fit to temperature-independent ΔH and ΔS. The y intercept and slope provide –ΔS/R and ΔH, respectively.

